Milwaukee: Segregated Isolation
I was honored to receive the Hilldale Undergraduate Fellowship in 2019 to help fund research by Professor Song Gao and me investigating neighborhood isolation. The visualization below is the alternative design seen in my paper published in the journal Environment and Planning A titled Understanding neighborhood isolation through spatial interaction network analysis using location big data. Please check out the publication since it is a 'featured graphic' that tells a narrative. Also, be sure to scroll below the map to play around with the interactive chord diagram that visualizes mobility flows in Wisconsin.
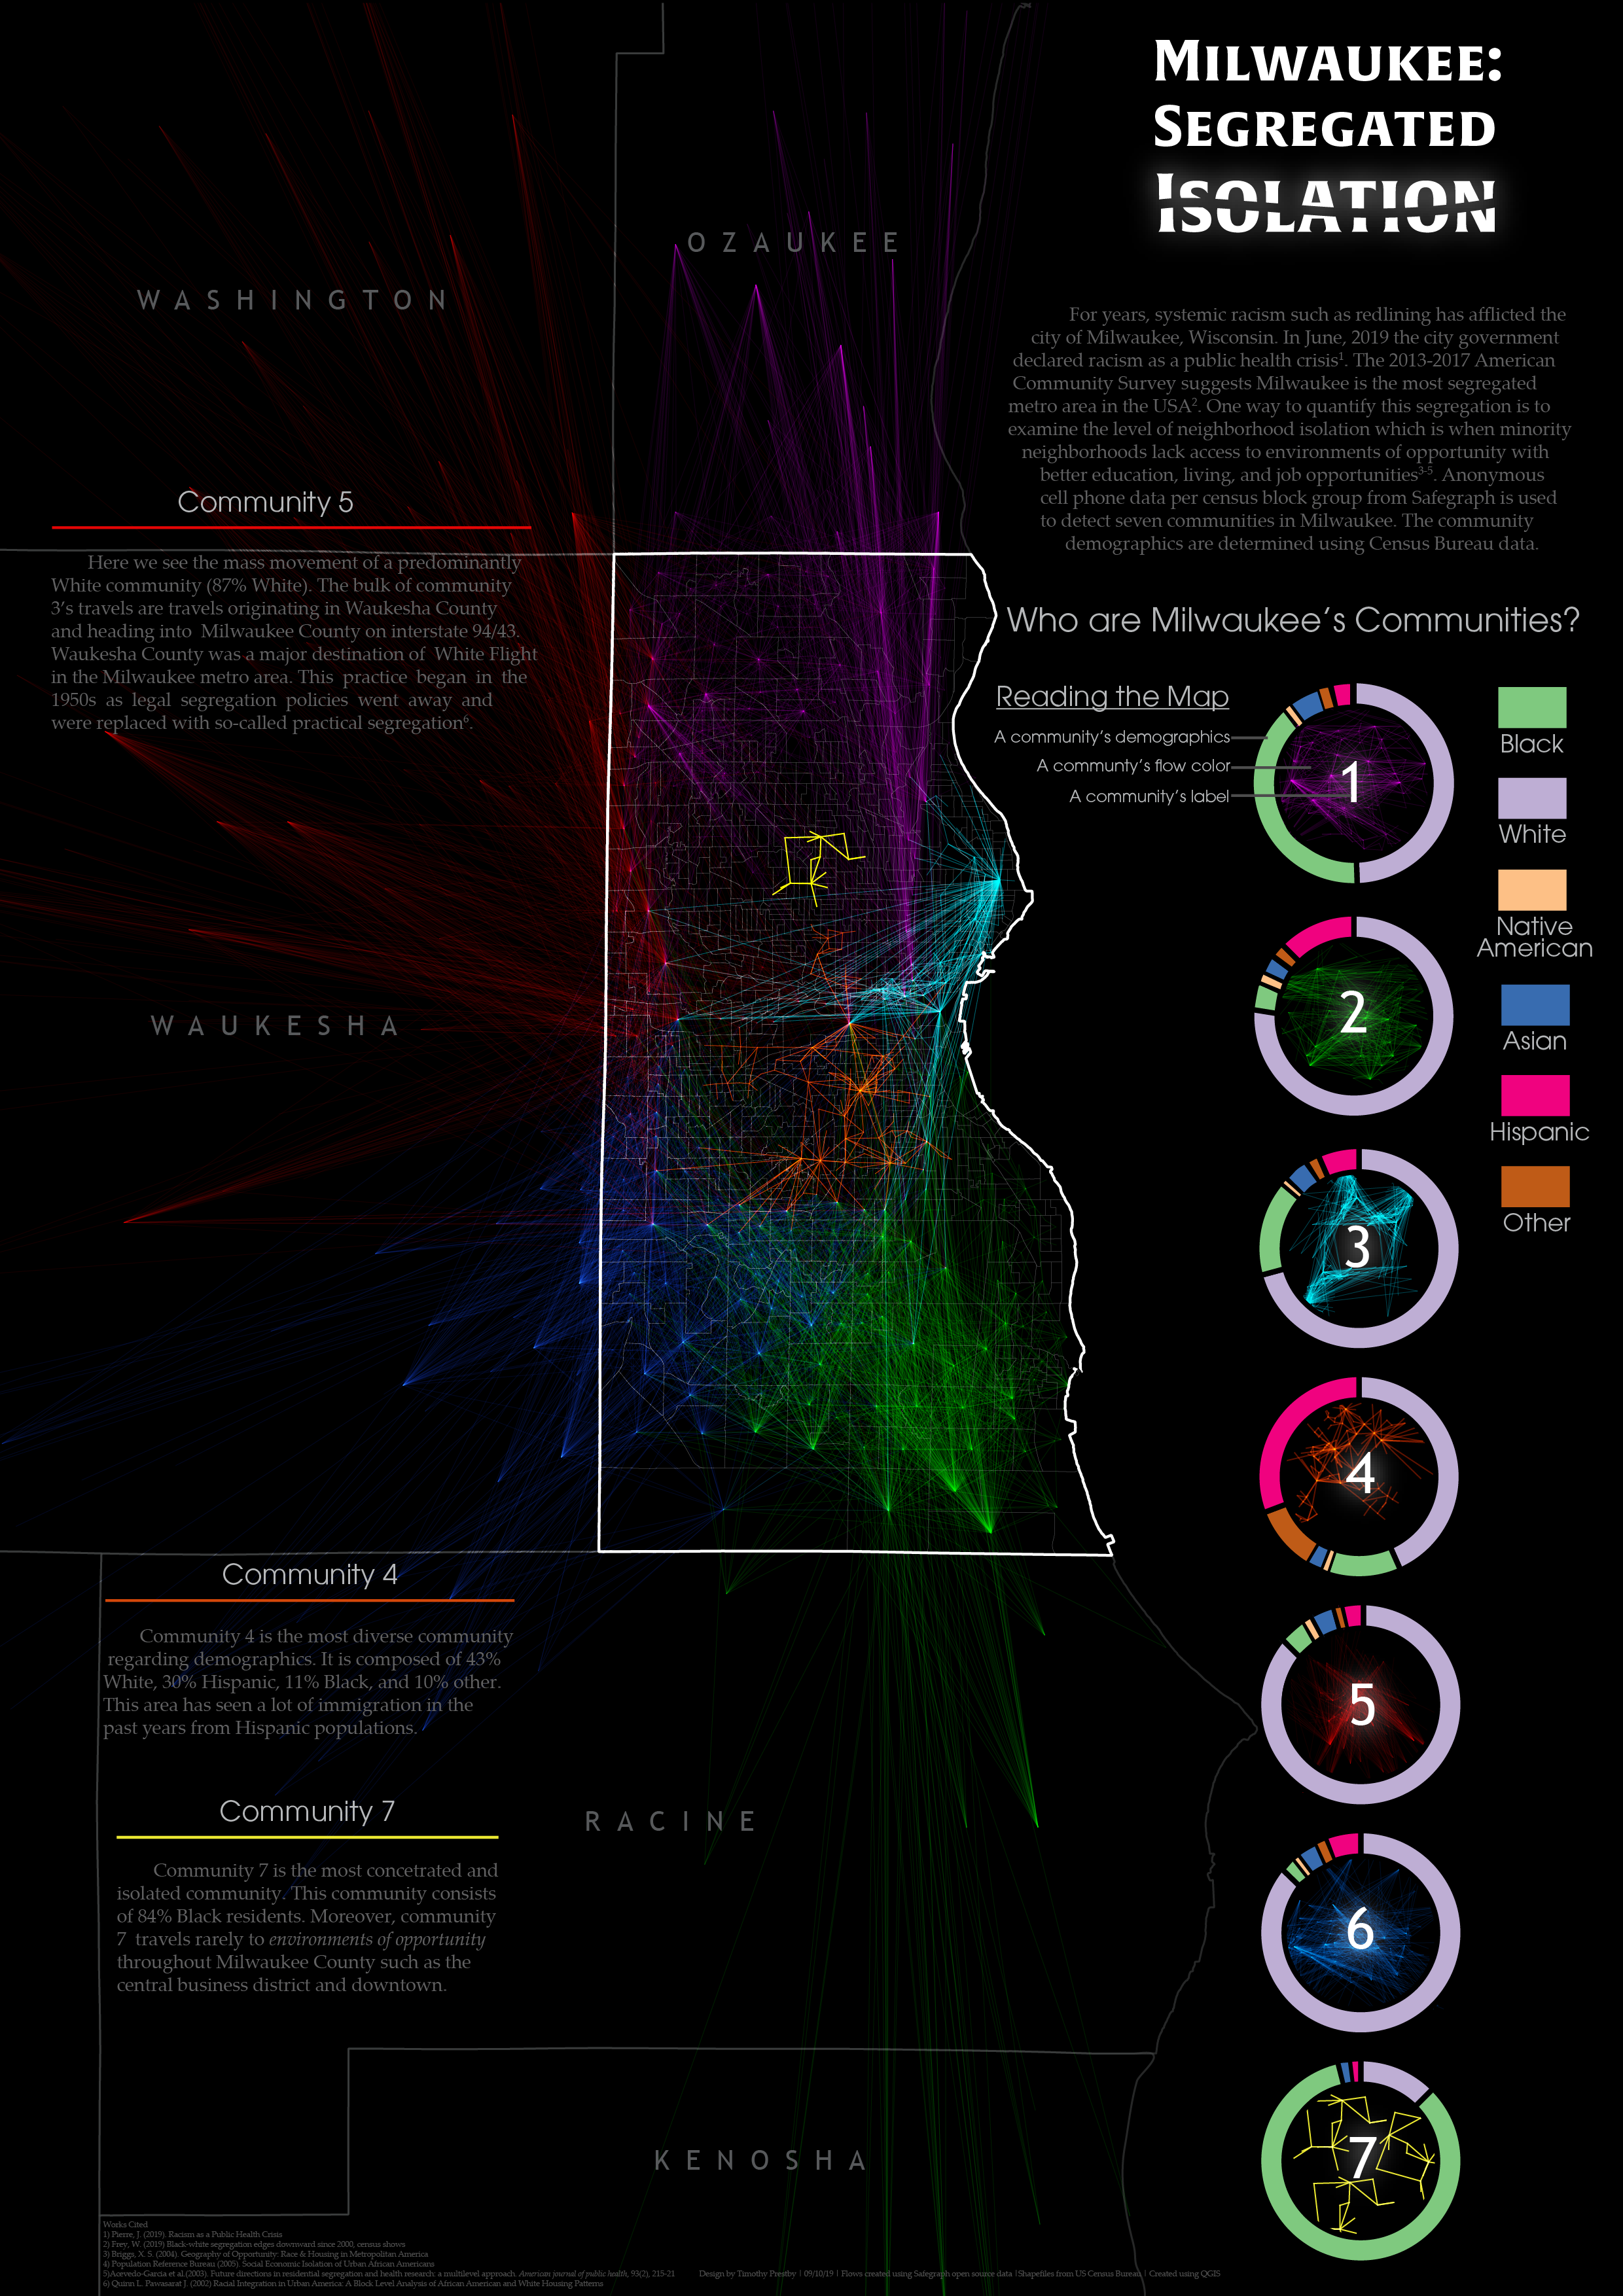
I collaborated with Yuhao Kang, Joe App, and Professor Song Gao on this project. I did the visualization, storytelling, and some data wrangling. Decades of racist housing policies in Milwaukee, WI have shaped it into one of the most racially segregated cities in the United States. Neighborhood isolation looms as a shadow of these policies and continues to deteriorate communities of color by undermining their very livelihoods. For the map and article, I wrote Python scripts to extract demographic and mobility data and R scripts to perform community detection on our mobility network. I then queried the data needed to create a set of line-strings and visualized the data in QGIS by iteratively manipulating hue, value, transparency, and line width. To supplement the map, I created a chord diagram from the ground up with an additional function that highlights the flows of a group when hovering over the group name. Ensuring the visualization was ethical was the most challenging part. I collaborated with many faculty studying feminist geography to come up with a solution. We decided to add a hybrid category to account for Hispanic and Latino individuals of any race. Meanwhile, the other categories of race do not count those who identify as Hispanic and Latino to their totals. Effectively, we ensure that another marginalized instance of neighborhood isolation is made visible to hopefully promote awareness and change. “Community 4” has the largest proportion of Hispanic population and embodies this isolation with a more compact network. I choose a set of colors in the donut chart that are color vision deficiency friendly. The community colors were also chosen to reduce overlap among colors that may cause problems with readers who have color vision deficiency. To aid in the interpretation of the map, communities 4, 5, and 7 have callouts that narrate what is going on.
The chord diagram was designed entirely by me as a supplement to the static data representation. The chord diagram is designed to visualize the flow composition of a network. In this case, the data depicts all of Wisconsin as a comparison to just one city shown in the map. I decided to color each flow based on which group had the larger percentage of travelers. For instance, the Other-White chord is colored blue, the respective color assigned to "Other" since there are 85.1% of "Other" travels to White neighborhood versus a mere 0.7% of White travels to "Other" neighborhoods. I am most proud of getting the mouseover events to work. Many existing chord diagrams will highlight a single flow if hovered over, but I created a function that highlights all the flows of a particular group if a user hovers over the text description such as "Other." Overall, the project allowed me to get more comfortable working with APIs and made me conceptualize major use tasks before creating an accompanying function.
Created using QGIS, R, Pandas, and Python