Placing Wetlands in the Watershed: Situating Millbrook Marsh, Pennsylvania in the Chesapeake Bay Watershed
This project aims to situate Millbrook Marsh, which contains 50 acres of protected wetlands, in the greater Spring Creek, Susquehanna, and Chesapeake Bay Watersheds. Specifically, we want to highlight how the myriad benefits that the Chesapeake Bay Watershed ecosystem provides for human wellbeing (ecosystem services) are a product of many smaller ecosystems and watersheds. We also sought to highlight that these services are not equally available to people because of ongoing environmental justice issues.
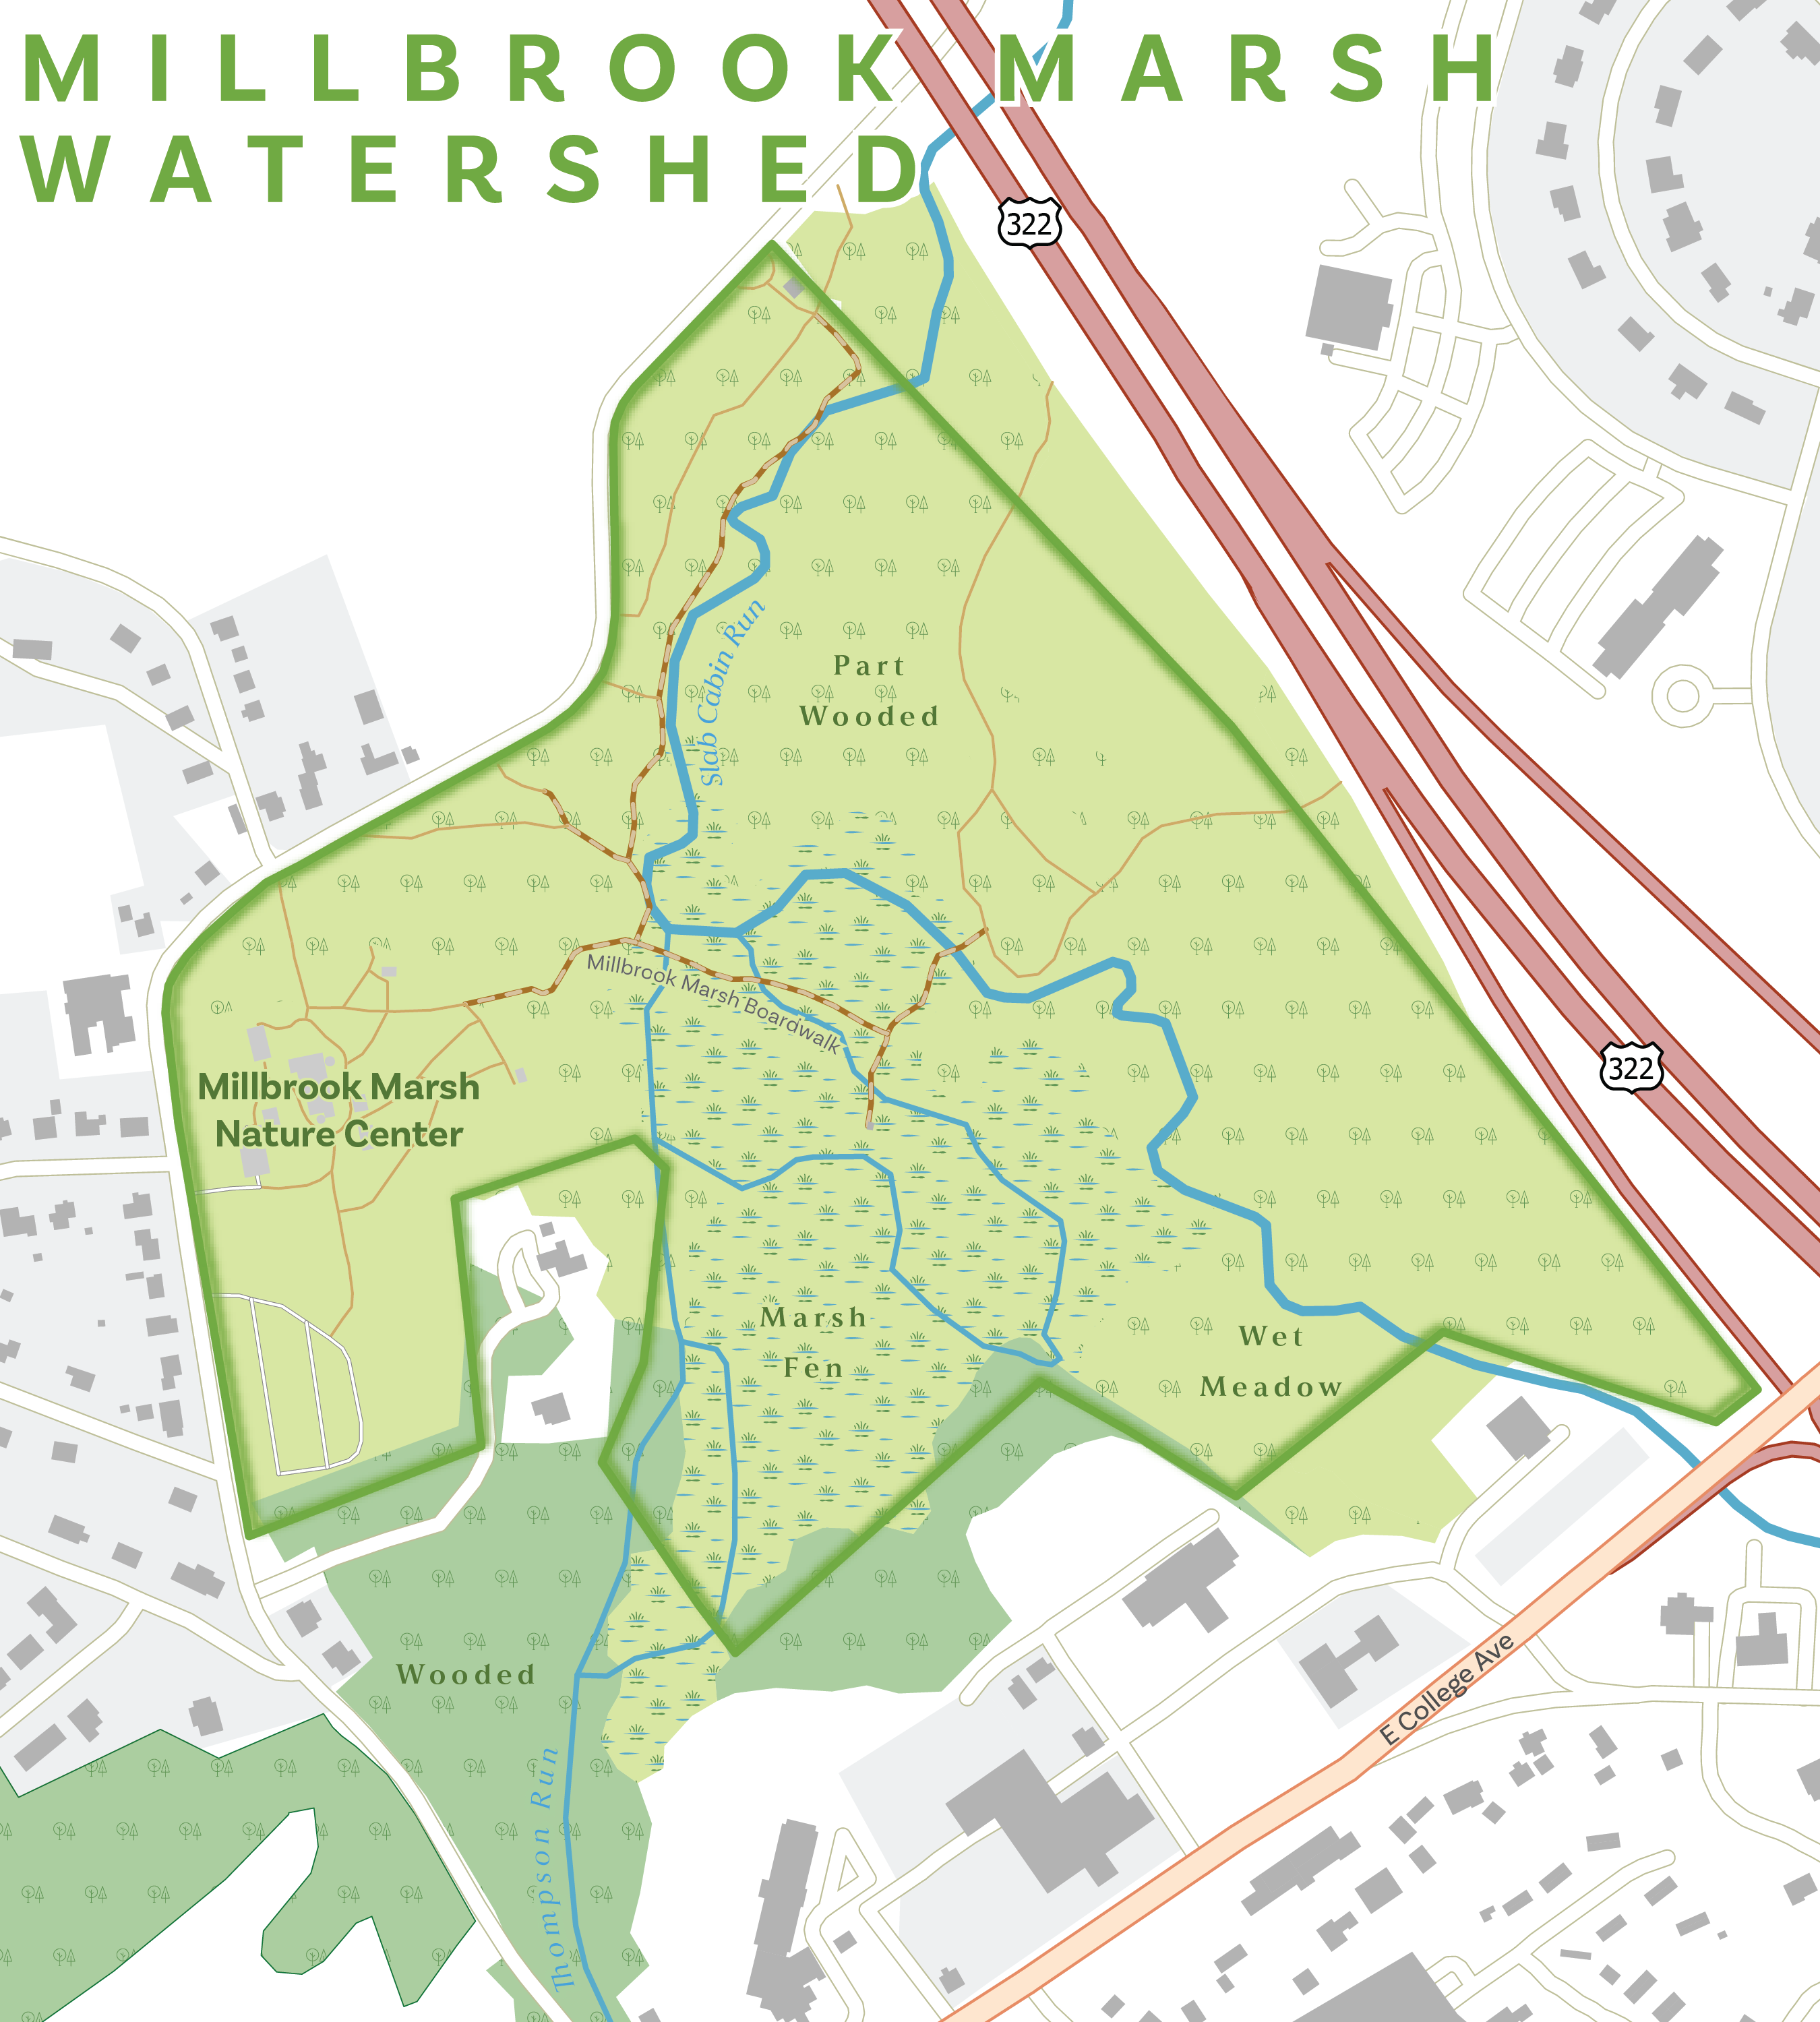
To accomplish these goals, I created a set of four maps at four different scales. Three maps correspond to three different watersheds: The Chesapeake Bay Watershed, The Susquehanna Watershed, and the Spring Creek Watershed. The final map visualizes Millbrook Marsh which is a part of all these watersheds but at the largest scale, is a part of the Spring Creek Watershed. The main dataset featured in each map is the National Wetlands Inventory, a high-resolution vector dataset showing the location and type of wetlands across the United States. I colored the wetlands according to the default categorical scheme used by the U.S. Fish and Wildlife Service.
The wetlands data layer is the only thematic data layer in the Chesapeake Bay Watershed map to ensure that the vastness and mosaic of wetlands are captured. The Susquehanna Watershed map also features an environmental justice (EJ) layer that shows where communities facing environmental justice issues are located. These data come from the Pennsylvania Department of Environmental Protection, and the designation of an EJ is based on over 30 indicators. The EJ areas are visualized with an orange semi-transparent fill so that readers can still see the underlying basemap and wetlands data. The Spring Creek Watershed map features a different EJ data layer that shows the percent of people living in a municipality that have access to outdoor recreation areas within a ten-minute walk. This dataset was created by The Pennsylvania Department of Conservation and Natural Resources in 2020. Finally, the map of Millbrook Marsh highlights key features of the nature center including boardwalks, buildings, and major vegetation types. These data were acquired from Open Street Maps and surveying contractors working with Millbrook Marsh. The basemap was designed from scratch using data from Natural Earth and the National Hydrography Dataset.
Each map has a unique color that the map’s overall aesthetic is based on. For instance, The Chesapeake Bay Watershed map has a pink title, and the boundary of the watershed is also colored pink. Smaller scale maps show the nested watersheds within (e.g., the boundaries of the Susquehanna and Spring Creek Watersheds are visible in the Chesapeake Bay map).
I created the maps using ArcGIS Pro and Adobe Illustrator. I first merged all the wetland data from eight different states into a single layer. Next, I filtered the data to remove features that were too small to be seen. I applied different filter parameters depending on the scale of the map. I symbolized the river data using the ‘visibility filter’ attribute which was developed by the U.S. Geological Survey to help cartographers determine which rivers should be shown at a particular scale. I applied a simplification and smoothing processing tool on the various boundaries, rivers, wetland features to generalize the maps. After completing all the necessary geoprocessing, I exported the document to Adobe Illustrator to clean up the design. Specifically, I tweaked the colors to be suitable for print, designed textures for the Millbrook Marsh map, and added curved labels for rivers.
I was able to make the maps thanks to extensive feedback from Trevor Birkenholtz and Lily Houtman. Both were instrumental to the outcome of this set of maps.
Created using ArcGIS and Illustrator