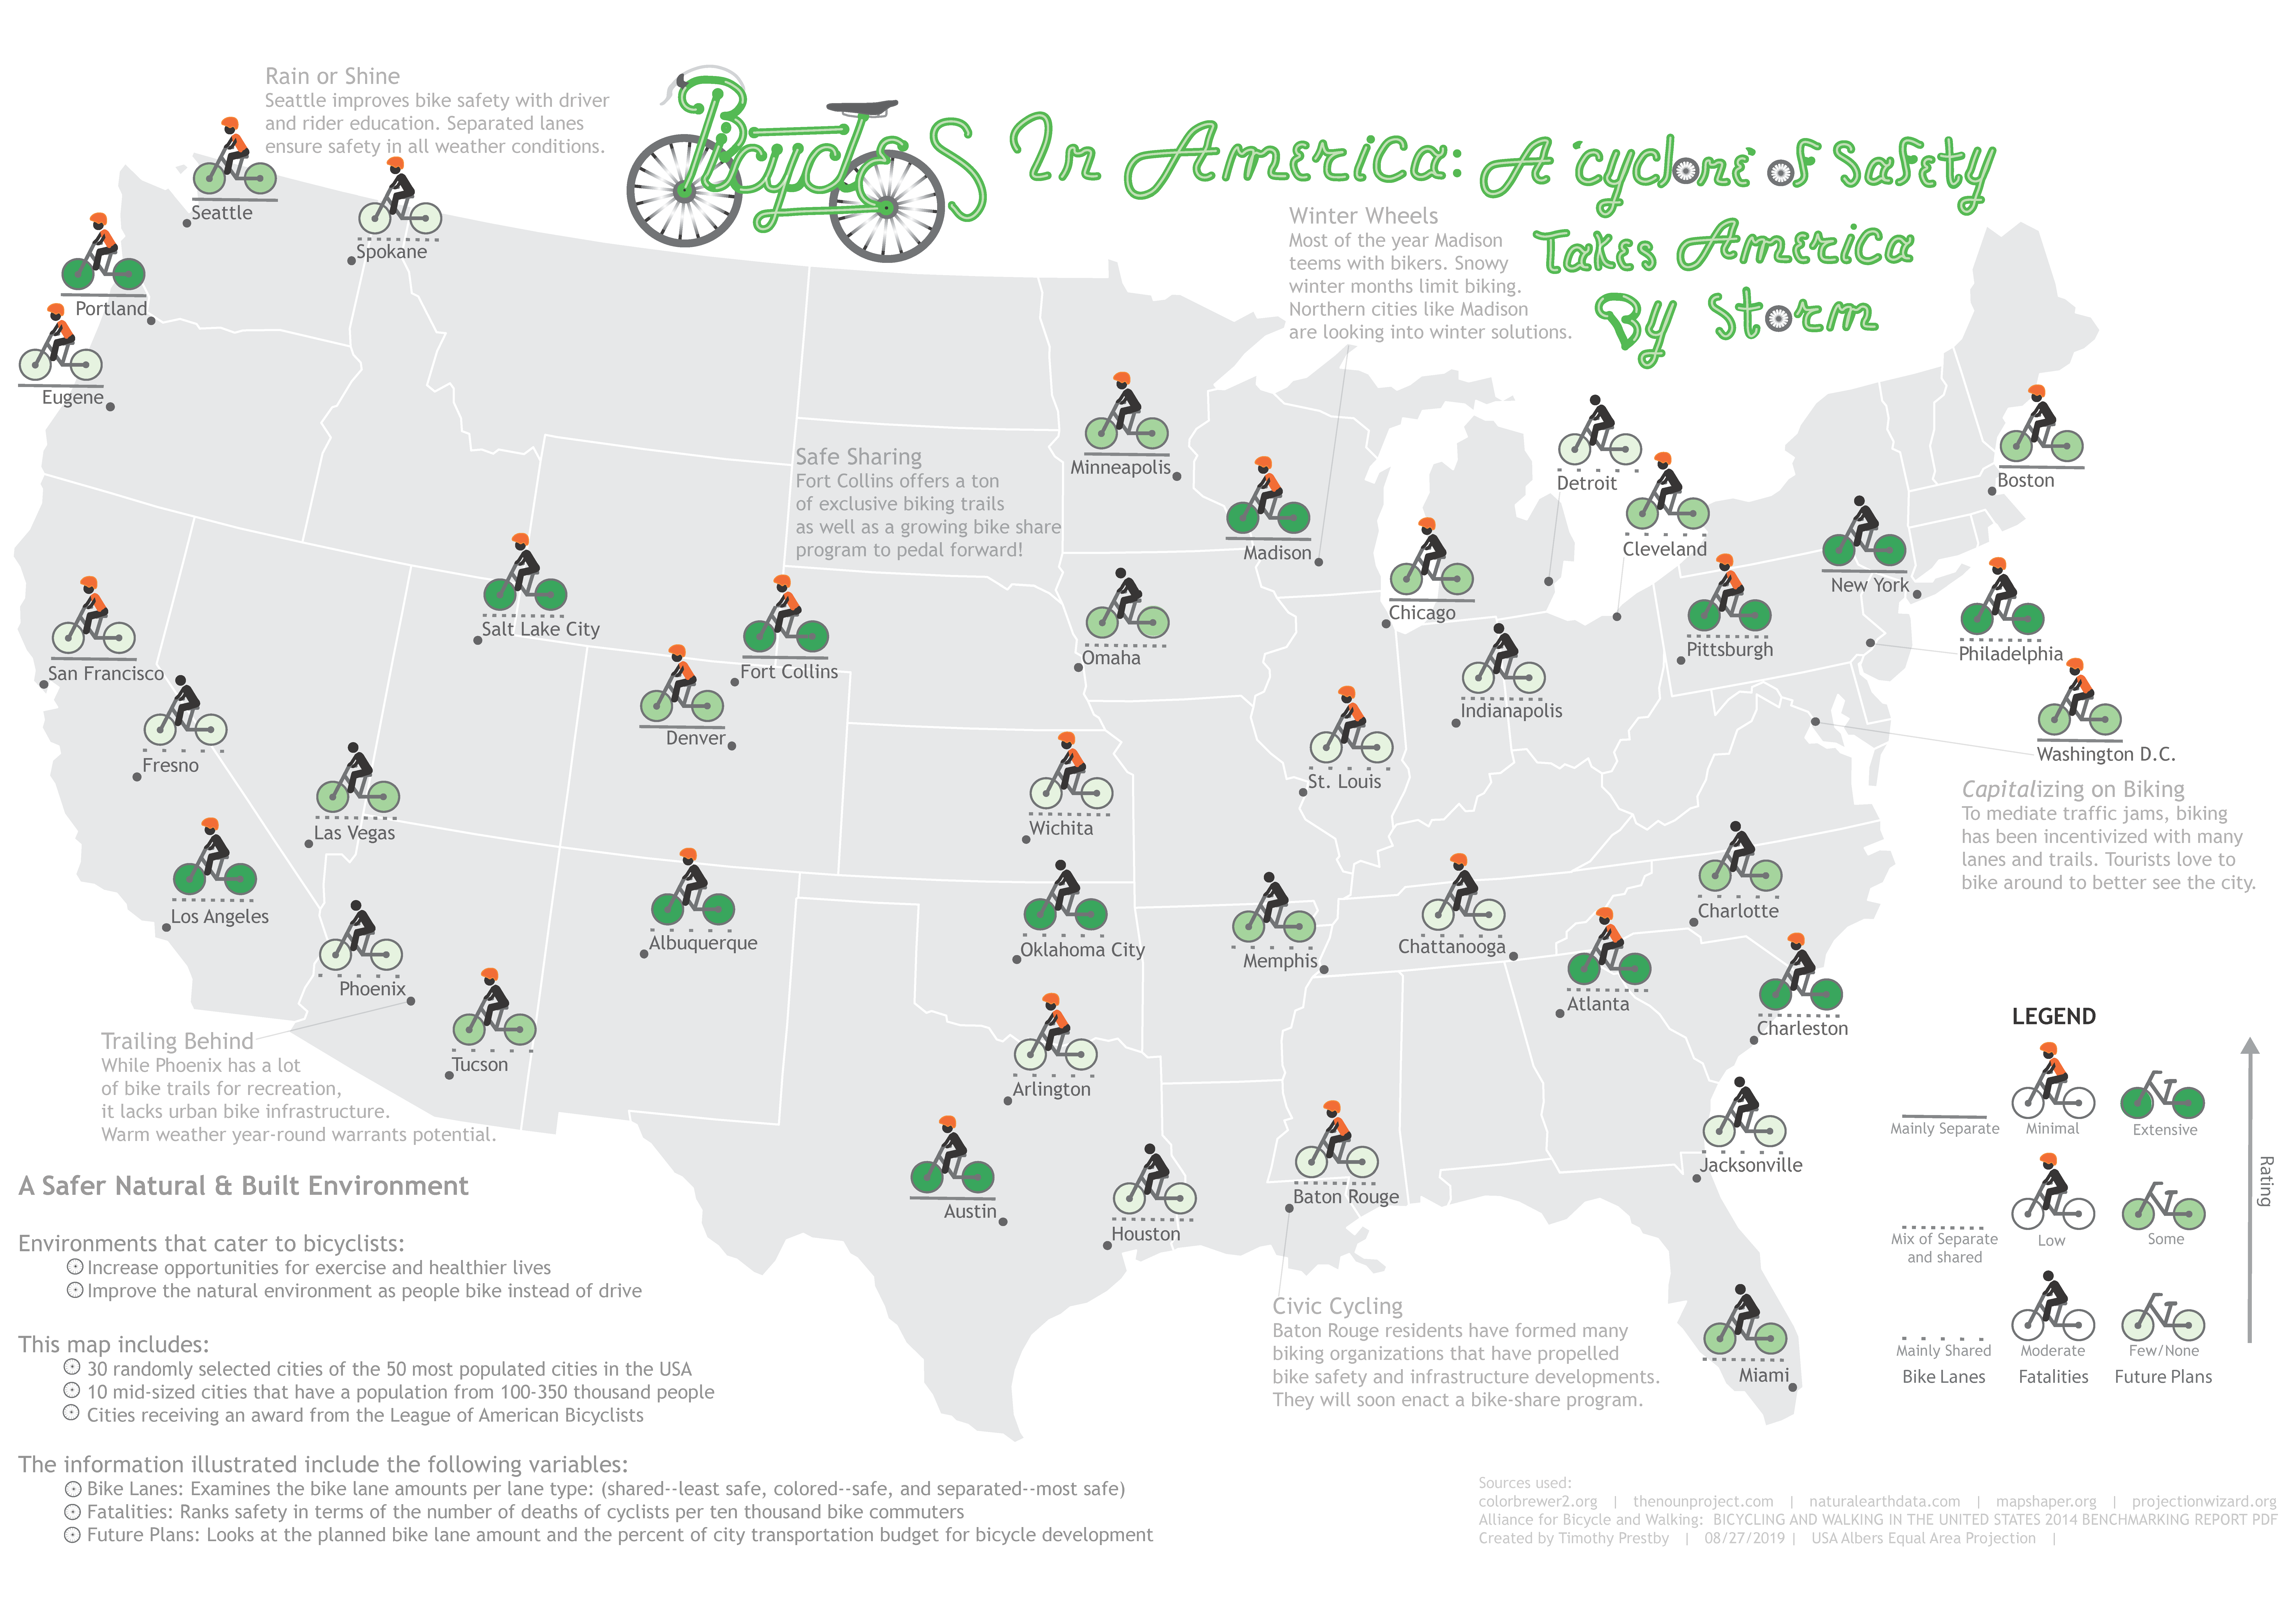
Bicycles in America
I am an avid biker and after travelling to the Netherlands, I realized how much safety influences people's desire to bike. So, I decided to evaluate the safety and quality of biking infrastructure in the US.
I began by scouring the internet for a reliable data source that could represent the 'bikeability,' or the friendliness of a city to biking. I found a report by the Alliance for Biking & Walking that scored the safety of biking in major US cities across a set of metrics. I translated the report from PDF to csv and translated the raw data into ordinal data sets classified into four quartiles ranging from 0-3 with 0 being the poorest score and 3 being the highest score. Three variables (bike lanes, fatalities, and future plans) were then created based on one or more of the safety metrics. The final variables were then classified into three, equal-interval bins that determined their representation. The classes were kept to three to ensure the map reader was not overloaded with variation and could still pick out the differences.
I designed the word art title in Adobe Illustrator freehand using the brush tool. The design of the varying levels of the representation were the most difficult yet most fun part of the project. I engaged in a lot of sketching and peer feedback before moving into Illustrator with my ideas. I received inspiration for the 'chernoff' bike representations from the noun project.
1st Place: UW Geography Department Petchenik Graduate Award in Cartographic Design
1st Place: Keynote’s Choice Award for 2019 WLIA Annual Conference Map Competition
1st Place: Thematic Map Award for 2019 WLIA Annual Conference Map Competition
Created using ArcGIS, Excel, and Illustrator
